New knowledge in solar physics only arises from an in-depth understanding of the scientific data, i.e., we have to learn everything of a photon’s history on its journey from the Sun to its detection on Earth.
Story of sunspots from birth to decay
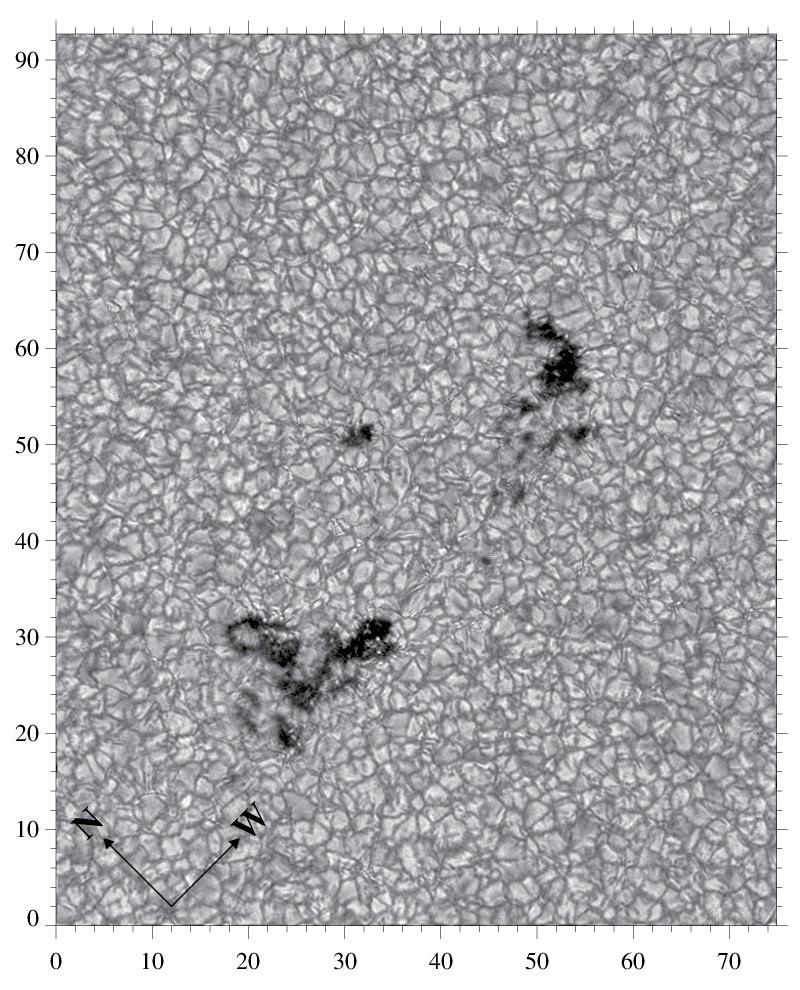
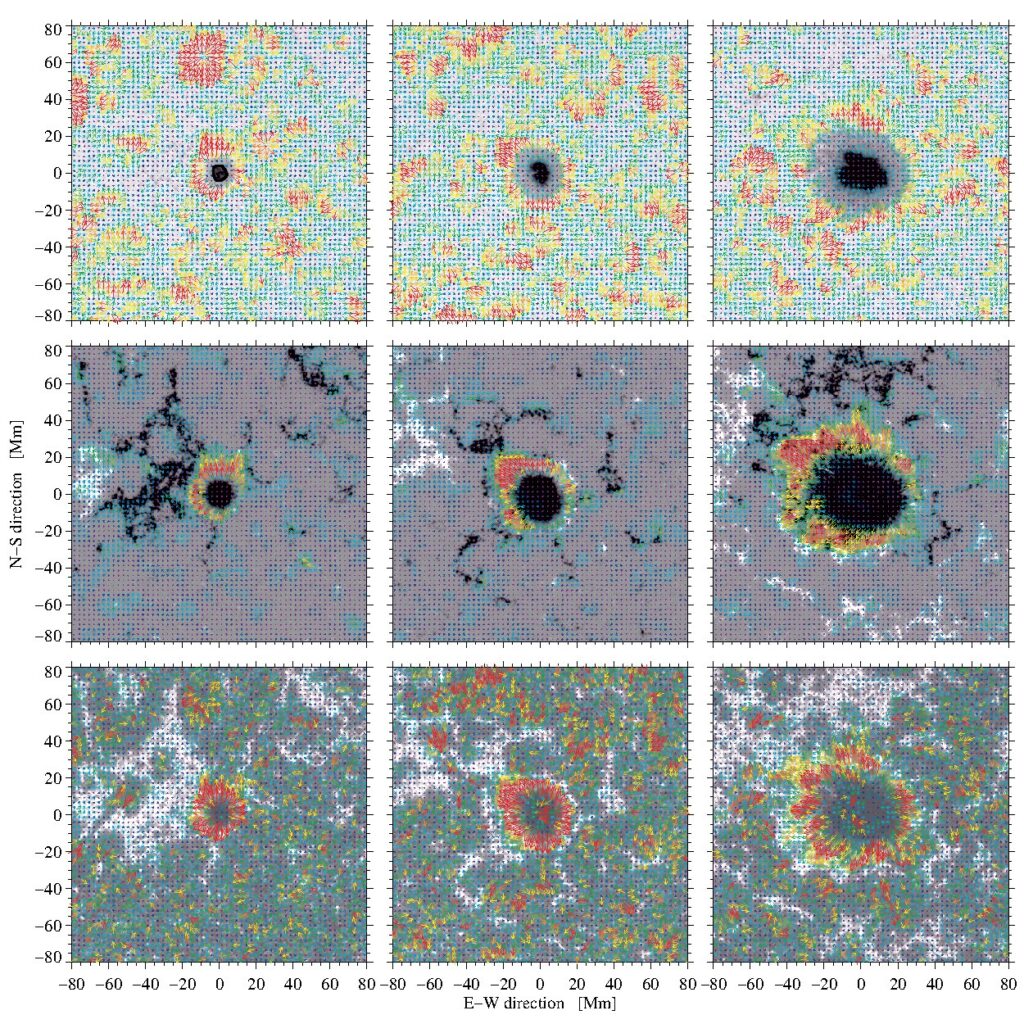
My main research focus is the interaction between plasma and magnetic field on the solar surface and higher atmosphere during the birth, maturity, and decay of sunspots. Sunspots are the manifestation of the magnetic field on the Sun. High-resolution observations of formation and decay of sunspots starting from simple spots to complex spot groups, which are embedded in complex photospheric plasma flows, are needed to advance our knowledge of generating and dissipating magnetic fields.
Large scale flows and magnetic fields
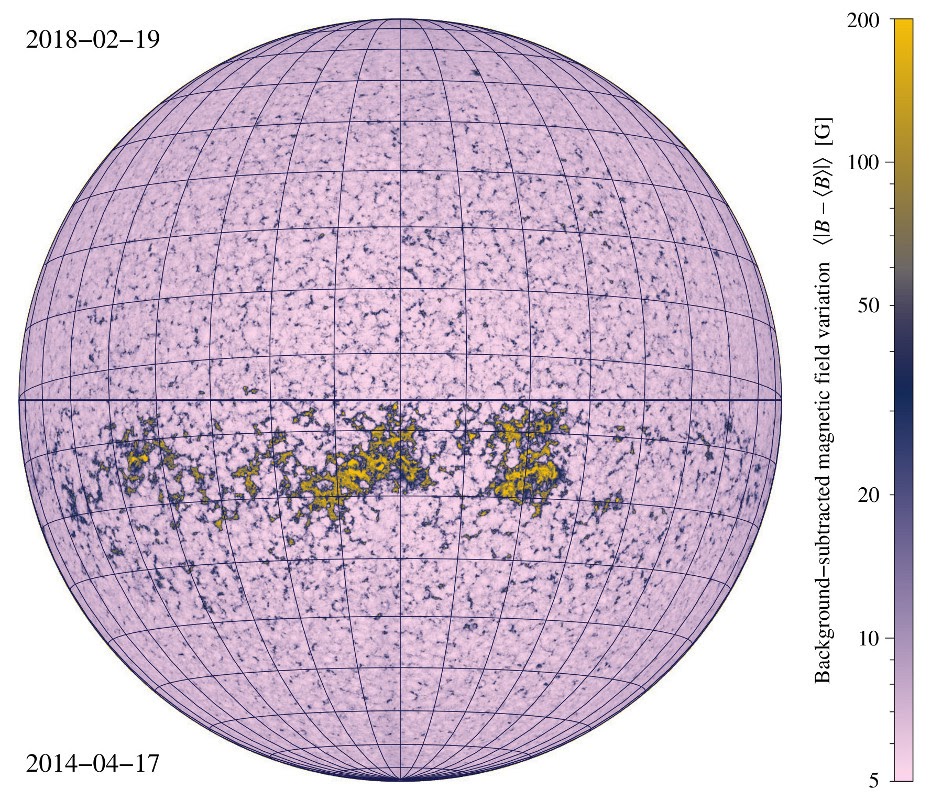
The long-term and large scale variation of the solar magnetic and flow fields are extensively studied using synoptic full-disk data. We employed local correlation tracking on solar dynamics observatory images and magnetograms to investigate the long-term variation in the flows around “theoretician sunspots”. To assess and visualize the temporal variation of the photospheric magnetic field and the UV λ160 nm intensity on a global scale we proposed Background Subtracted Activity Maps (BaSAMs).
Flares and eruptive events
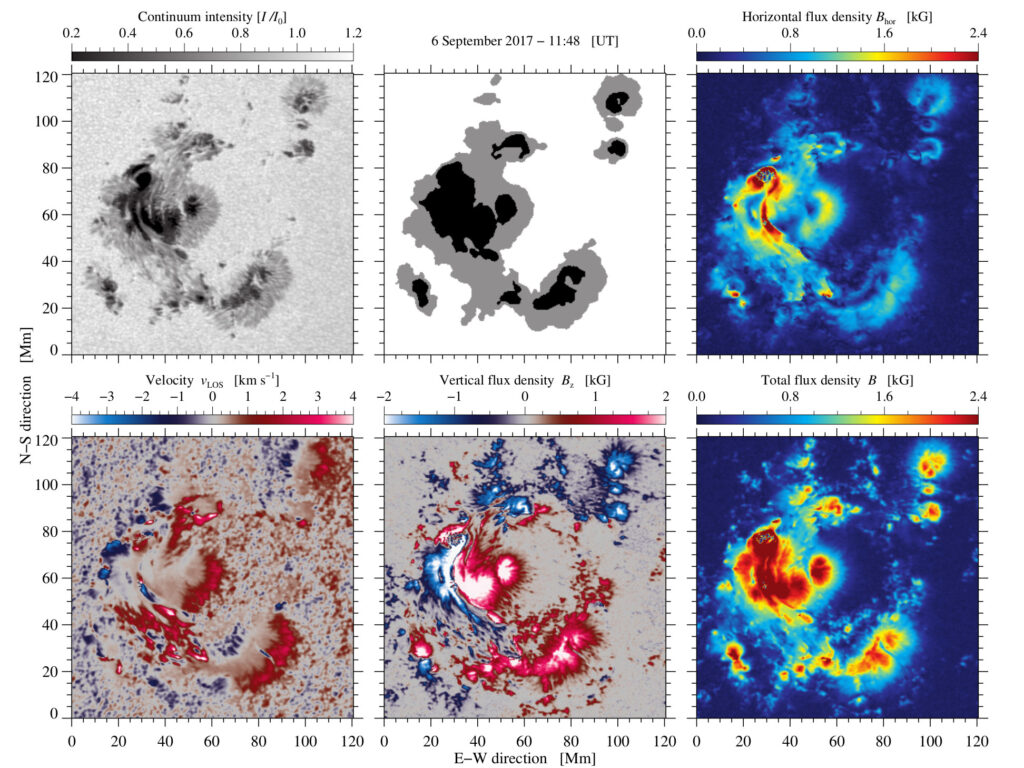
The cosmos is filled with many fascinating heavenly bodies. However, the most crucial to the human race is our nearest star – the Sun. It provides us with all the energy needed to sustain life on Earth. However, sometimes this energy is released in an eruptive way. The sudden release of energy is called solar flare. I explore solar flares using optical and UV/EUV images. I employed various optical flow measuring techniques to measure changes in horizontal proper motions before, during, and after flares. Shown below is an example figure from one of my case studies related to two consecutive X-class flares observed in September 2017.
On 6 September 2017, a major X2.2 flare occurred at 08:57 UT followed by another powerful X9.3 flare at 11:53 UT. Both flares produced extremely high X-ray emission and even left signatures in white-light. The X9.3 flare was the strongest flare in the current solar cycle No. 24. Even though these two flares occurred in the same region and followed each other shortly, they differed significantly. During the X2.2 flare, the white-light flare kernels were confined and limited to small patches. In contrast, the white-light kernels for the X9.3 were more extended and formed a two-ribbon configuration. Notably, these flares also altered the magnetic field topology in the surroundings, creating regions with penumbral decay and umbral strengthening. The changes in the flow fields during the pre-, interim-, and post-flare phase traced the energy buildup and release in the active region. The shear flows, like cars driving in opposite directions on both sides of the center divider on a highway, drag magnetic field lines with them. The observed photospheric shear motions created a highly non-potential field configuration, which provided the energy that powered these X-class flares. All this supports the scenario, where the X2.2 flare sets the stage for more extended flare emission in the X9.3 flare, which was associated with a filament eruption and coronal mass ejection.
Observations
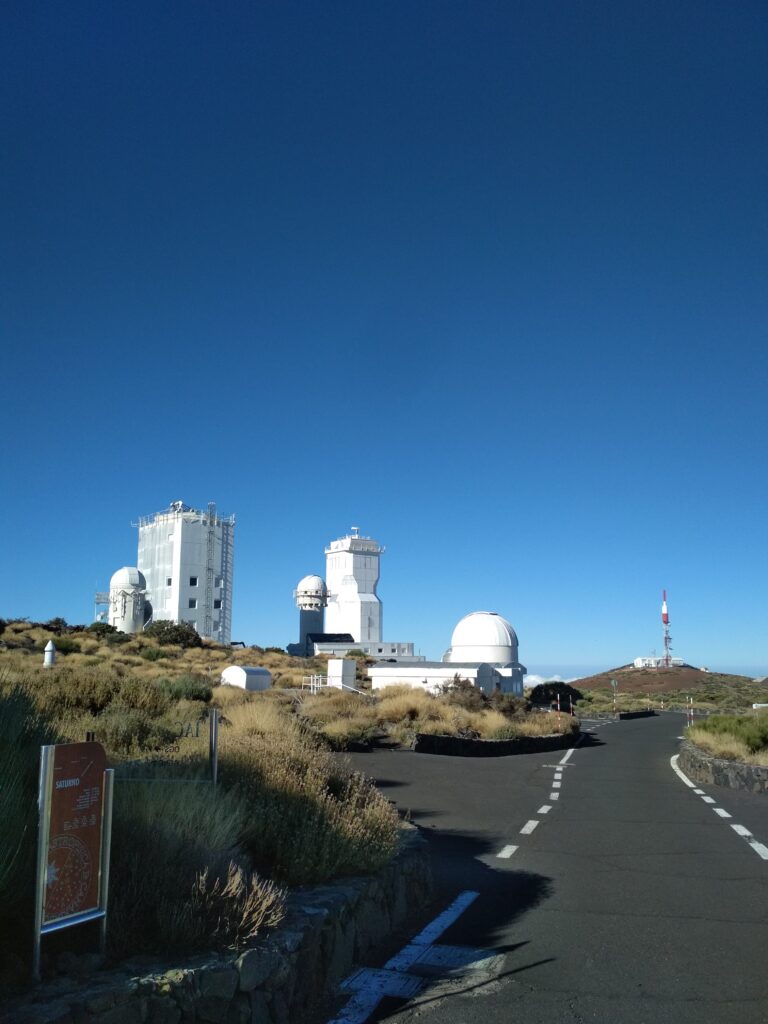
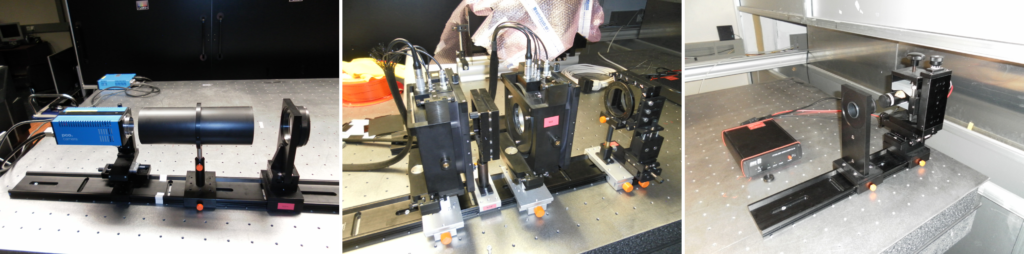
To obtain the required data for my projects, I successfully organized and carried out thirteen observing campaigns, including two coordinated campaigns in 2015 August and 2016 September, involving ground-based telescopes such as GREGOR, Vacuum Tower Telescope (VTT), Goode Solar Telescope (GST), and Dunn Solar Telescope (DST) as well as space missions Hinode and Interface Region Imaging Spectrograph (IRIS). I was also involved in the technical campaigns involving testing the quality of Fabry-Pérot etalons of the GREGOR Fabry-Pérot Interferometer (GFPI) and testing the new M-LITE 2M CMOS cameras in the GFPI.