Thesis Defence: April 2025
My PhD student Robert Kamlah defended his thesis last week. His thesis consisted of two published papers and one currently under review. He was awarded Magna cum laude.
It took us longer than expected to reach this point—COVID, parental leave, and many personal and professional setbacks got in the way. However, I am very proud of him. I wish him all the best and hope to continue our collaboration.
Congratulations, Dr. Kamlah!
Year 2024: December 2024
This year is ending, and I was thinking, did I do something good this year? Then I realized I had done something. Some papers were published. Some grant applications were written and submitted. Some proposals were rejected, and some results are awaited. So overall, the year feels like a mixed bag. However, I am full of gratitude for all that I managed this year.
The highlight was my single-author paper in GRIS IFU data analyzing two very different solar pores, published in A&A. There, I used t-SNE to reveal the onion-peel structure of the magnetic field around both pores.

My PhD student Robert Kamalh got his second paper based on GREGOR data published in Solar Physics, and his third paper is under review. Plus, he submitted his thesis 🙂
Got to contribute to some interesting papers such as Alex Pietrow Flare’s paper, Ioannis Kontogiannis’s COCOMAG, and Ekaterina Dineva’s Solar Eclipse Sun as a Star Spectra paper.
Let’s hope the next year is full of more interesting research.
Wish you all a happy holiday and a Happy New Year!!
Latest paper: May 2023
My PhD student Robert Kamlah got his paper accepted to be published in A&A this month. The paper is the first in the series of his work focusing on the high-resolution observations of solar magnetic features.
What is this paper about? Solar activity appears on the solar surface in various shapes and forms. Most prominent are the sunspots. However, before sunspots become sunspots, i.e., before they establish penumbra sunspots are called pores. How and when pores get penumbra is an ongoing field of research. With Robert’s paper, we tried to get an insight into this process using Goode Solar Telescope data of a pore with a thick granular light bridge.

We used high-resolution images taken in photospheric TiO and imaging spectroscopic data in the chromospheric Halpha line. We computed horizontal proper motions around pores in both the photosphere and chromosphere. Chromospheric LOS Doppler velocities were estimated. Furthermore, we created Background Substracted Activity Maps (BaSAMs) which gave access to persistent variation in the field of view.
What did we learn? Small-scale interactions are conducive for pores’ transition to sunspot, i.e., for penumbra formation. The signature of future penumbra can be already seen in chromospheric Halpha images where a clear super penumbral structure was foreshadowing the photospheric penumbra which developed later in the evolutionary stage of the observed pore.
Read more about it here: https://www.aanda.org/articles/aa/pdf/forth/aa45410-22.pdf
SOLARNET Conference: April 2023
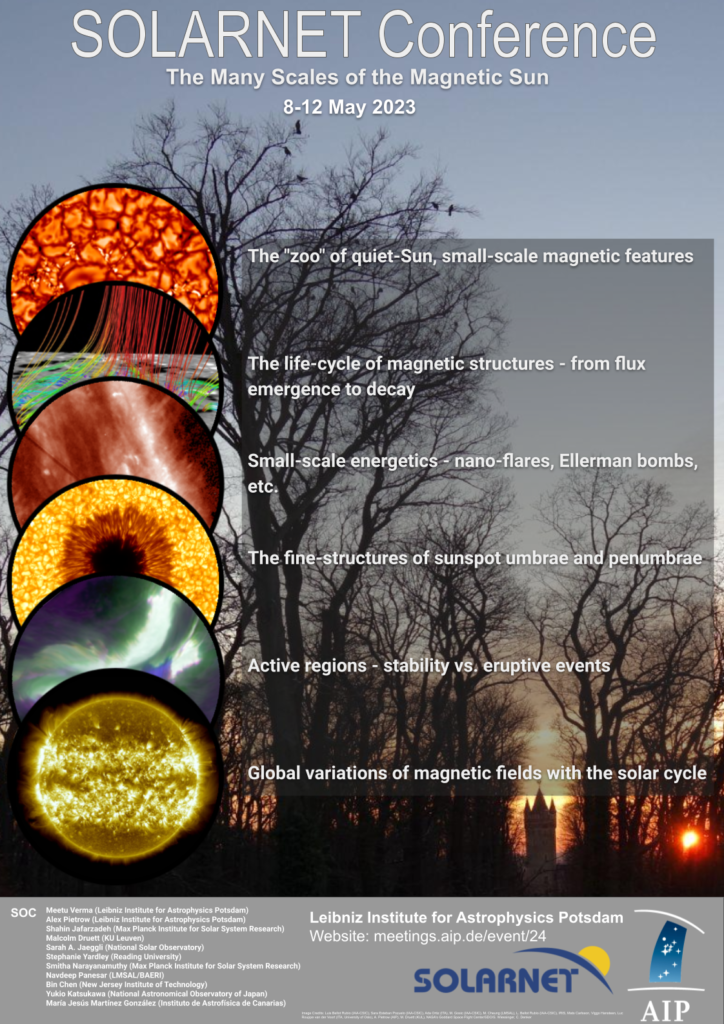
We are organizing the SOLARNET II Conference “The Many Scales of the Magnetic Sun”. The conference will take place at Haus H, Telegrafenberg, Potsdam from 8-12 May 2023. It will be the first in-person SOLARNET conference after the pandemic.
Registration and abstract submission (now only for posters) are open till 14 April 2023.
https://meetings.aip.de/event/24/
I am really looking forward to meeting old and new colleagues.

Latest Paper: February 2023
Our work on the GREGOR imager is now published in JATIS. The paper is about the improved High-resolution Fast Imager (HiFI+) which is a multiwavelength imaging filtergraph and was commissioned at the GREGOR solar telescope at Observatorio del Teide, Izaña, Tenerife, Spain, in March 2022. The previous imager HiFI is updated to include six wavelength bands (Ca II H at 396.8 nm, G-band at 430.7 nm, blue continuum at 450.6 nm, narrow- and broad-band Hα at 656.3 nm, and TiO bandhead at 705.8 nm). Read more in detail here:
https://doi.org/10.1117/1.JATIS.9.1.015001
VDI-nachrichten article: June 2022
Very recently I had an opportunity to discuss my research with Iestyn Hartbrich from VDI-nachrichten who wrote a story on our Sun on the longest day of the year (21 June). It was fun to discuss with him. We discussed sunspots and penumbra. Why high-resolution observations are needed? Unfortunately, the article is not available openly.
https://www.vdi-nachrichten.com/technik/raumfahrt/unsere-sonne-im-portraet/
Latest Paper: June 2022
Our paper on activity indices is out on Astronomical Notes. This work is led by Ekaterina Dineva. I am honored to be part of it. In this paper, we discussed various chromospheric activity indices based on the Sun-as-a-star spectra and full-disk images. Spectra are obtained from PEPSI. Whereas images are from SDO and Chrotel. Solar activity indices give a measure of long-term solar magnetic activity which is generated by the global or local dynamo action. Comparing different activity indices helps us to understand how the solar activity cycle varies for different atmospheric layers. Read more in detail here: https://onlinelibrary.wiley.com/doi/full/10.1002/asna.20223996
European Solar Physics Nugget: April 2022
I wrote the sixth European Solar Physics Nugget, which is now available to read here: https://est-east.eu/nuggets/46-espn/1166-espn-6
New Role: June 2021
Recently with the birth of my daughter, I started a new role in my life. Every day I am learning new things about myself and her 🙂

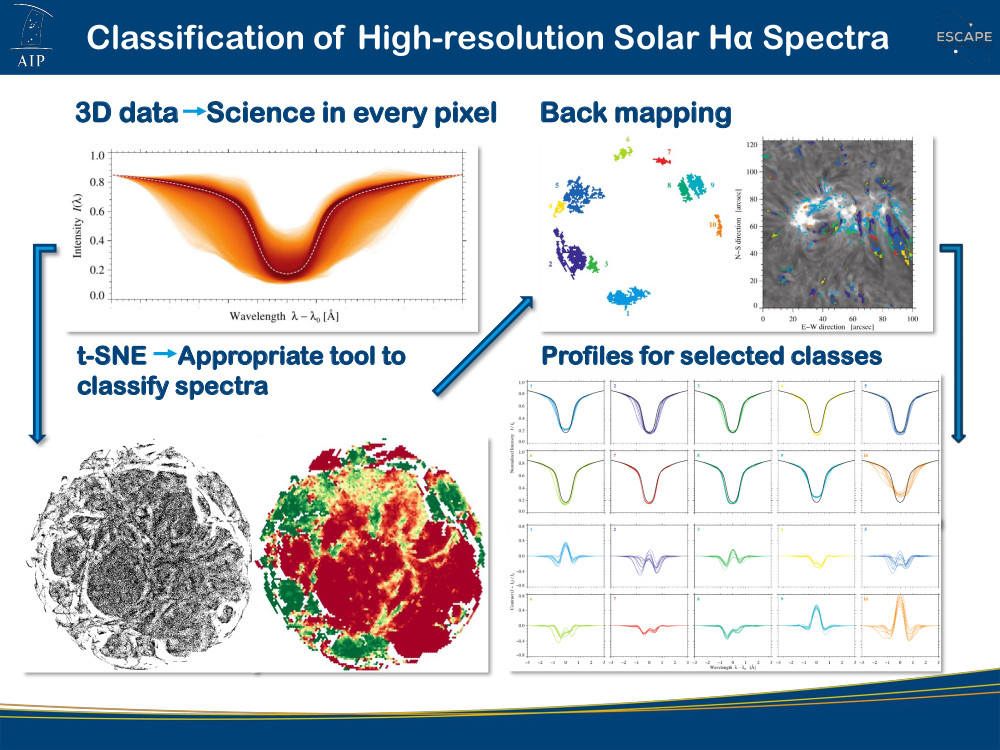
Latest paper: Classification of High-resolution Solar Hα Spectra using t-distributed Stochastic Neighbor Embedding – 11/12/2020
https://arxiv.org/abs/2011.13214
This is my second project where we used an unsupervised machine learning algorithm. I started this project for Machine Learning in Heliophysics meeting in Amsterdam in 2019. I hoped that I would be able to wrap up this project before I attend the meeting. I guess too much wishful thinking. I had a few obstacles at the very beginning of this project. However, I am very happy with the end result. So what is this ApJ paper about?
As observational solar physicists, we collect lots of data, specially spectra. The number of spectra accumulated at a medium-size telescope (Vacuum Tower Telescope, Tenerife) over one observing day easily reaches up to millions. Hence, we require tools to identify and classify spectra with minimal human intervention. Our exploratory work provides the framework and some ideas on how to tailor a classification scheme toward specific spectral data and science questions. For this project, we used high-spectral resolution Hα spectra.

t-distributed Stochastic Neighbor Embedding (t-SNE) is a machine learning algorithm, which is used for nonlinear dimensionality reduction. In this application, it projects Hα spectra onto a two-dimensional map, where it becomes possible to classify the spectra according to the results of Cloud Model (CM) inversions. The CM parameters optical depth, Doppler width, line-of-sight velocity, and source function describe properties of the cloud material. Initial results of t-SNE indicate its strong discriminatory power to separate quiet Sun and plage profiles from those that are suitable for CM inversions. Furthermore, we discussed our choice of various t-SNE parameters, the impact of seeing on classification, the results arising from various types of input data, and the link of the identified clusters to chromospheric features. Although t-SNE proves to be efficient in clustering high-dimensional data, the human inference is required at each step to interpret the results.
Latest paper: Seeing parameters and image quality metrics – 23/11/2020
https://arxiv.org/abs/2011.04346
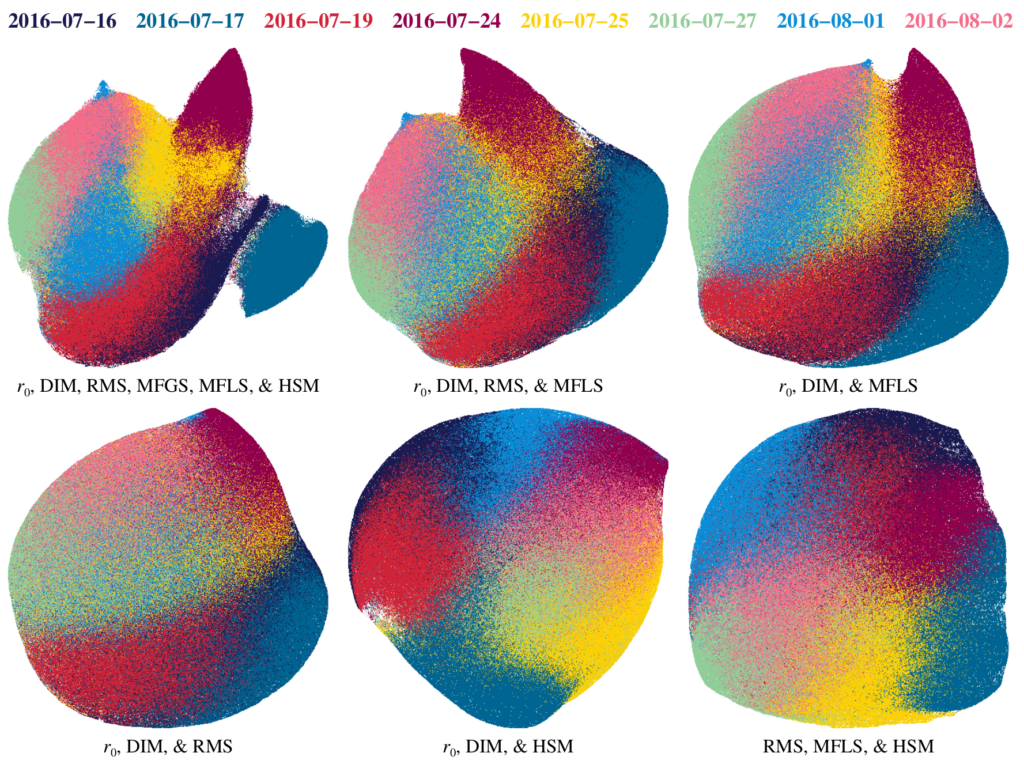
My PhD student Robert Kamlah recently got his first paper accepted to be published in Solar Physics. In his paper, we compare different image quality metrics and parameters describing the seeing characteristics. Time-series of solar granulation were obtained at the solar disk center with the Vacuum Tower Telescope (VTT) at Observatorio del Teide (OT), Izaña, Tenerife, Spain. The time-series were recorded with two synchronized, large-format, high-cadence sCMOS imagers, where one camera always observed the Fraunhofer G-band, whereas the other camera observed at various wavelength settings from Ca II H at λ396.8 nm to the near-infrared at λ861 nm. A correlation analysis yields the wavelength dependence of the image quality metrics and seeing parameters, and Uniform Manifold Approximation and Projection (UMAP) is employed to characterize the seeing on a particular observing day. In addition, the image quality metrics and seeing parameters are used to determine the field-dependence of the correction provided by the adaptive optics system.

well-defined regions of the UMAP projections in all combinations. However, the best separation is rendered by using at least four of the mentioned parameters.